Inflow ML: Inflow volume that storage has received in Mega Litres (ML)
POE: The probability of exceedance describes the likelihood of a specific volume being exceeded in the given time period. E.g. 90% POE means that 90 out of 100 times we would expect higher inflow volumes. A 50% POE is equal to a median average.
% Average: Mean Average - The value obtained by dividing the sum of all inflow volumes by the number of years data is available. Therefore a 50% mean average does not equal a 50% POE.
The inflow statistics are based on historical flow records that have been adjusted to match climate conditions observed since 1975.
June 2025 Inflows
Murray, Goulburn & Ovens System Storages
Table of inflows for June 2025 for the Murray (Dartmouth and Hume), Goulburn (Eildon and Goulburn Weir) & Ovens (Buffalo and William Hovell) Storages.
| Monthly Inflow |
Murray System |
Goulburn System |
Ovens System |
| Inflow (ML) |
50,800 |
64,900 |
16,774 |
23,459 |
11,074 |
4,095 |
| POE |
44% |
82% |
96% |
88% |
74% |
85% |
| % of Average |
80% |
36% |
15% |
24% |
33% |
23% |
Broken, Loddon & Campaspe System Storages
Table of inflows for June 2025 for the Broken (Nillahcootie), Loddon (Cairn Curran, Tullaroop and Laanecoorie) & Campaspe (Eppalock) Storages.
| Monthly Inflow |
Broken System |
Loddon System |
Campaspe System |
| Inflow (ML) |
100 |
14 |
158 |
0 |
72 |
| POE |
93% |
98% |
88% |
Min |
87% |
| % of Average |
2% |
0% |
5% |
0% |
0% |
Year to Date Inflows: July 2024 to June 2025
Murray, Goulburn & Ovens System Storages
Table of inflows - Year to date - for the Murray (Dartmouth and Hume), Goulburn (Eildon and Goulburn Weir) & Ovens (Buffalo and William Hovell) Storages.
| Water year 2024/2025: July 2024 to June 2025 |
Murray System |
Goulburn System |
Ovens System |
| Inflow (ML) |
529,272 |
720,634 |
465,527 |
513,680 |
160,680 |
85,414 |
| POE |
78% |
94% |
96% |
88% |
86% |
89% |
| % of Average |
67% |
30% |
37% |
46% |
43% |
46% |
Broken, Loddon & Campaspe System Storages
Table of inflows -Year to date - for the Broken (Nillahcootie), Loddon (Cairn Curran, Tullaroop and Laanecoorie) & Campaspe (Eppalock) Storages.
| Water year 2024/2025: July 2024 to June 2025 |
Broken System |
Loddon System |
Campaspe System |
| Inflow (ML) |
7,207 |
4,883 |
3,031 |
1,415 |
13,505 |
| POE |
93% |
96% |
95% |
94% |
92% |
| % of Average |
14% |
5% |
7% |
3% |
9% |
Inflow data for 2024/2025 against different climate scenarios
Climate Scenarios
The scenarios for different inflow conditions were produced using the following terminology:
- Wet Scenario : Inflow volumes that are greater in 10 years out of 100 (10% POE)
- Average Scenario : Inflow volumes that are greater in 50 years out of 100 (50% POE and not average)
- Dry Scenario : Inflow volumes that are greater in 90 years out of 100 (90% POE)
- Extreme Dry Scenario : Inflow volumes that are greater in 99 years out of 100 (99% POE)
In the inflow graphs below actual inflow data is compared to these four scenarios. Inflows are measured in Giga Litres (GL).
Murray System - Dartmouth Dam
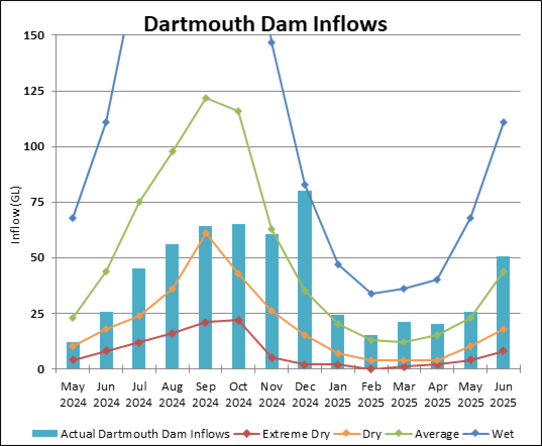 Dartmouth Dam Inflows for 2024/2025. Actual data compared to four climate scenarios.
Table of actual Dartmouth Reservoir inflows for 2024/2025 compared to four climate scenarios
Murray System - Hume Dam
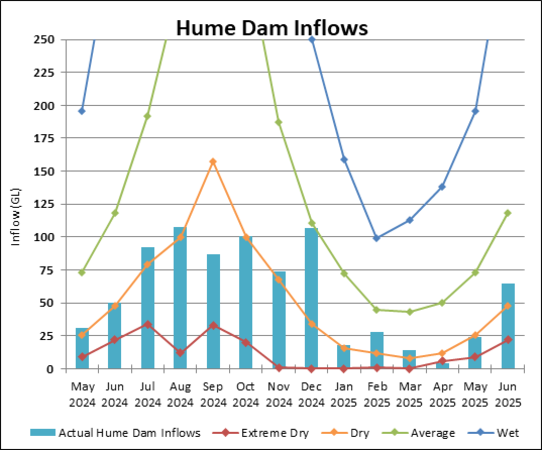 Hume Dam Inflows for 2024/2025. Actual data compared to four climate scenarios.
Table of actual Hume Dam inflows for 2024/2025 compared to four climate scenarios
Goulburn System - Lake Eildon
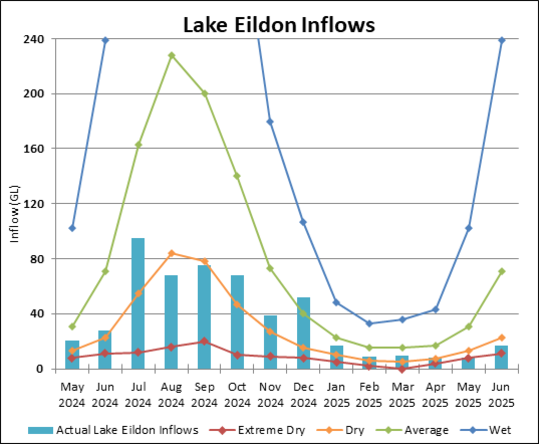 Graph of Lake Eildon Inflows for 2024/2025. Actual data compared to four climate scenarios.
Table of actual Lake Eildon inflows for 2024/2025 compared to four climate scenarios
Goulburn System - Goulburn Weir
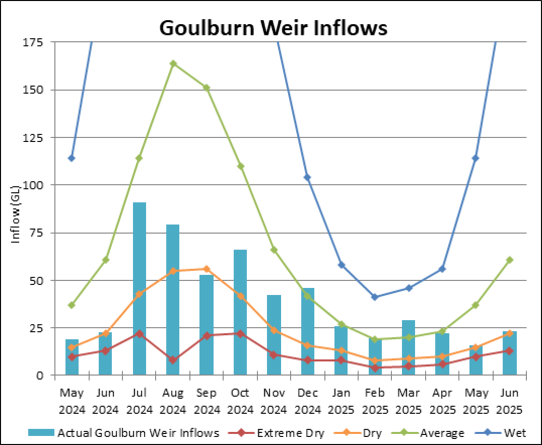 Goulburn Weir Inflows for 2024/2025. Actual data compared to four climate scenarios.
Table of actual Goulburn Weir inflows for 2024/2025 compared to four climate scenarios
Ovens System - Lake Buffalo
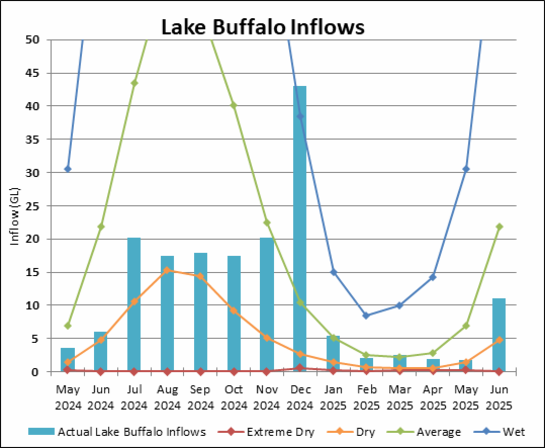 Lake Buffalo Inflows for 2024/2025. Actual data compared to four climate scenarios.
Table of actual Lake Buffalo inflows for 2024/2025 compared to four climate scenarios
Ovens System - Lake William Hovell
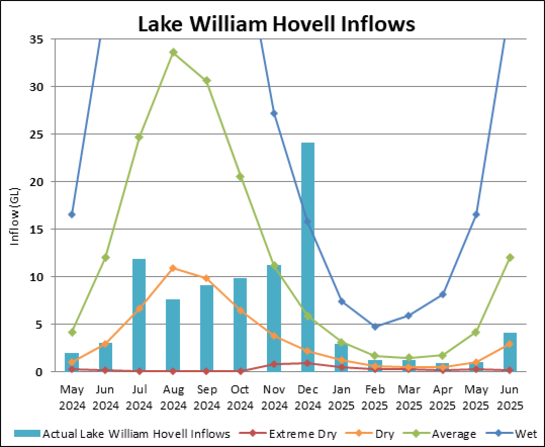 Lake William Hovell Inflows for 2024/2025. Actual data compared to four climate scenarios.
Table of actual Lake William Hovell inflows for 2024/2025 compared to four climate scenarios
Broken System - Lake Nillahcootie
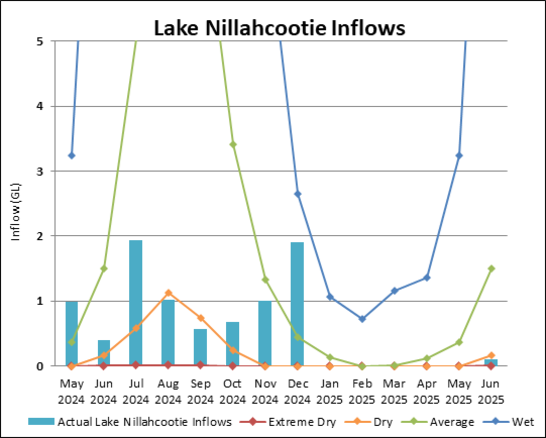 Lake Nillahcootie Inflows for 2024/2025. Actual data compared to four climate scenarios.
Table of actual Lake Nillahcootie inflows for 2024/2025 compared to four climate scenarios
Loddon System - Cairn Curran Reservoir
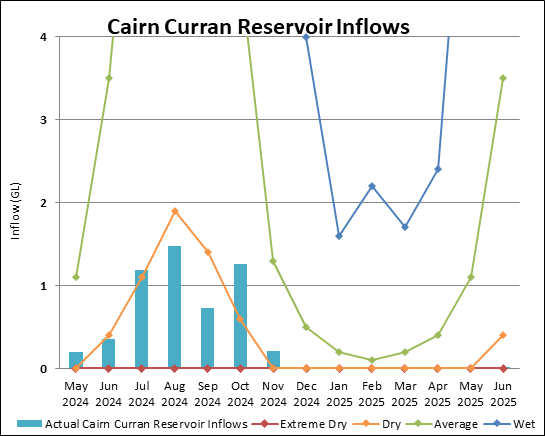 Cairn Curran Reservoir Inflows for 2024/2025. Actual data compared to four climate scenarios.
Table of actual Cairn Curran Reservoir inflows for 2024/2025 compared to four climate scenarios
Loddon System - Tullaroop Reservoir
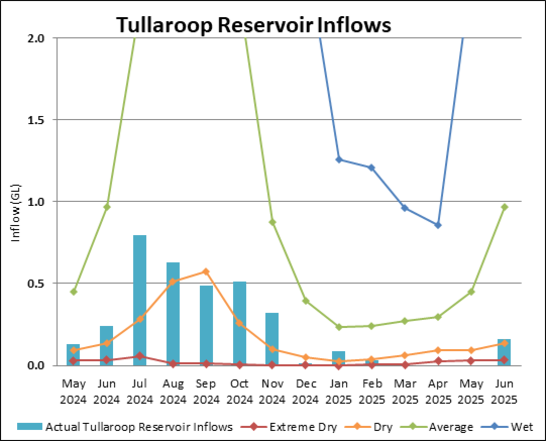 Tullaroop Reservoir Inflows for 2024/2025. Actual data compared to four climate scenarios.
Table of actual Tullaroop Reservoir inflows for 2024/2025 compared to four climate scenarios
Campaspe System- Lake Eppalock
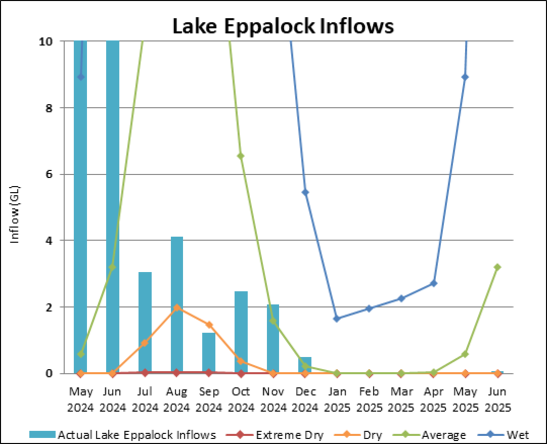 Lake Eppalock Inflows for 2024/2025. Actual data compared to four climate scenarios.
Table of actual Lake Eppalock inflows for 2024/2025 compared to four climate scenarios