Releases from Lake Hume continue to trigger spills from spillable water accounts in the Murray system. An update to the deductions from spillable water accounts will be made as part of the July 1 seasonal determination assessment.
The risk of spill in the Murray system at 1 July 2024: 80%
This value represents the percentage of years that spills occur from Victoria’s share of Lake Hume taking into account the current storage volume, storage releases, inflows and evaporation from the storage using the historic data available.
Note: 10% or lower is the threshold for a declaration that would return water quarantined in spillable water accounts to allocation bank accounts.
Volume needed to fill Lake Hume at 1 July 2024: 1,002,625 ML
Click here to find the current volumes in Murray system spillable water accounts.
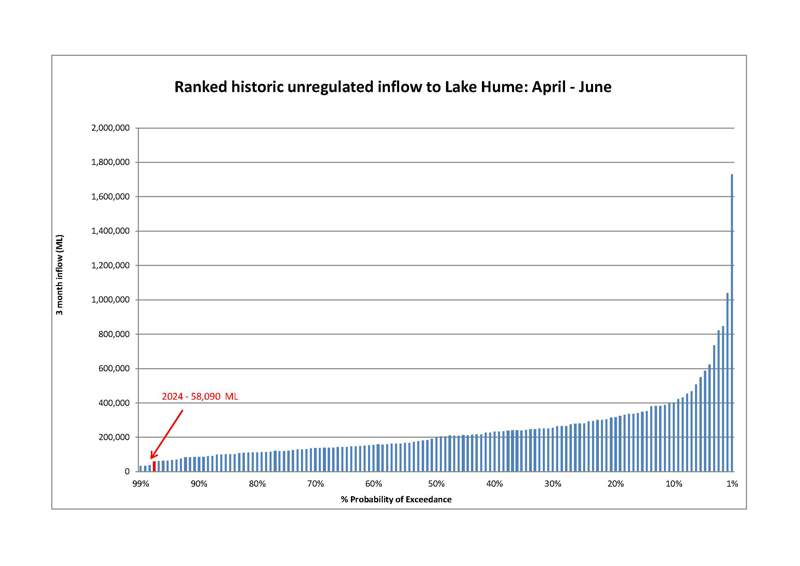
Graph - Ranked Historic Unregulated Inflow to Lake Hume: April - June

Ranked historic inflow to Lake Hume: April – June. Inflow for the April – June period is indicated by the red line: 90,871 ML
Description and Tabulation of the graphical content inflow to Lake Hume: April - June
A bar graph titled Ranked historic inflow to Lake Hume: April – June is on the page above. X axis label “% Probability of Exceedance” which spans 99% on the left to 1% on the right. Y axis label is “3 month inflow – units megalitres (ML)”. Significant highlighted data in the graph is the inflow for the April – June 2024 period is indicated by the red line: 90,871 ML.
Each % probability of exceedance is reported from 99% to 1%. The general nature of the information presented is inflow values of greater than 130,000 megalitres have a high probability of occurrence. Less than 10% probability of inflows above 642,700 megalitres.
Tabulation of data from the image above of the graph
| 99% |
71,230 |
| 2024 |
90,871 |
| 90% |
130,620 |
| 80% |
165,540 |
| 70% |
197,760 |
| 60% |
221,600 |
| 50% |
270,700 |
| 40% |
339,300 |
| 30% |
391,416 |
| 20% |
458,760 |
| 10% |
642,700 |
| 1% |
1,992,092 |
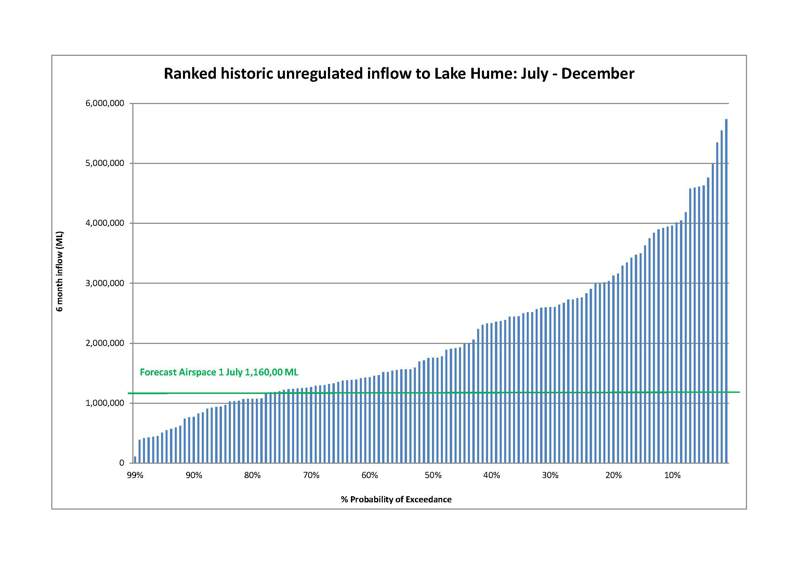
Ranked Historic Unregulated inflow to Lake Hume: July - December

Ranked historic inflow to Lake Hume: July – December. The difference between the full supply volume of Lake Hume and the volume at 1 July 2024 is shown by the green line:1,160,000 ML
Description and Tabulation of the graphical content inflow to Lake Hume: July – December
A bar graph titled Ranked historic inflow to Lake Hume: July – December is on the page above. X axis label “% Probability of Exceedance” which spans 99% on the left to 1% on the right. Y axis label is “6 month inflow – units megalitres (ML)”. Significant highlighted data in the graph is the difference between the full supply volume of Lake Hume and the volume at 1 July 2024 is indicated by the green line: 1,160,000 ML.
Each % probability of exceedance is reported from 99% to 1%. The general nature of the information presented is inflow values of greater than 711,000 megalitres have a high probability of occurrence. Less than 10% probability of inflows above around 3,626,000 megalitres.
Tabulation of data from the image above of the graph
| 99% |
328,008 |
| 90% |
711,340 |
| 80% |
993,980 |
| 70% |
1,193,164 |
| 60% |
1,306,320 |
| 50% |
1,621,900 |
| 40% |
2,128,740 |
| 30% |
2,406,400 |
| 20% |
2,942,540 |
| 10% |
3,626,740 |
| 1% |
5,213,124 |
Notes for charts:
The inflows to Hume are provided as a guide only with these inflows subject to state water sharing arrangements where inflows are shared 50:50 between Victoria and NSW.
There are 133 years of historic inflow data available for Lake Hume (inflow data for the period before the construction of the dam are based on modeled inflows). The first chart displays the volume of inflow to Lake Hume for the period 1 April to 31 June in each of those 133 years. The volumes of inflow shown are ranked in order from lowest to highest with the red line representing the volume of inflow recorded for the period in the current year (2024).
The second chart displays the volume of inflow to Lake Hume for the period 1 July to 31 December in each of the 133 years of historic data. The volumes of inflow shown are ranked in order from lowest to highest. The volume difference at Lake Hume between full supply and the storage volume on 1 July is indicated by the green line.
Probability of exceedance: Probability that the volume of inflow will be equal to or greater than a specified volume in any given year. For example, in the second chart, the probability that inflows to Lake Hume from 1 July to 31 December will be greater than 1,000,000 ML in any given year is 80%.
Additional notes:
- The information provided here for the Murray system does not take into consideration the State sharing arrangements for the Murray storages. Click here to find the status of Victorian shares of Murray storages via the MDBA website.
- The volumes in spillable water accounts can change due to seasonal determination increases. Active airspace management at Lake Hume could see reductions to Murray spillable water accounts prior to the storage reaching 100% capacity.
- Current year inflows are based on operational data.